In our last post, we explored the three main ways to measure central tendency: the mean, median, and mode. We learned how to calculate these “averages” to get a single number that represents a set of data.
However, a critical question soon arises: which data are we averaging? Are we talking about every single person in a group, or just a small piece of it?
This distinction is one of the most important concepts in statistics. It’s the difference between a population and a sample, and it’s why we have different symbols (\mu vs. \bar{x}) for what looks like the same calculation.
- What is a Population?
- What is a Sample?
- Why Do We Need Samples? The Problem of Impracticality
- Demystifying the Notation: Population Mean (\mu) vs. Sample Mean (\bar{x})
- Decoding the Formulas: Understanding Sigma Notation
- The Importance of a Good Sample
- Key Takeaways
- Frequently Asked Questions (FAQ)
What is a Population?
In statistics, a population is the entire, complete group of individuals, items, or data points you are interested in studying. It’s the whole “enchilada,” not just a slice.
- If you want to know the average height of all men in America, the population is all 150 million (or so) men in America.
- If you want to know the average lifespan of a specific brand of lightbulb, the population is every single lightbulb of that brand ever produced.
- If you want to know the average price of a house in New York City, the population is every single house in New York City.
The numerical value that describes a characteristic of a population is called a parameter. For example, the true average height of all American men would be a population parameter.
What is a Sample?
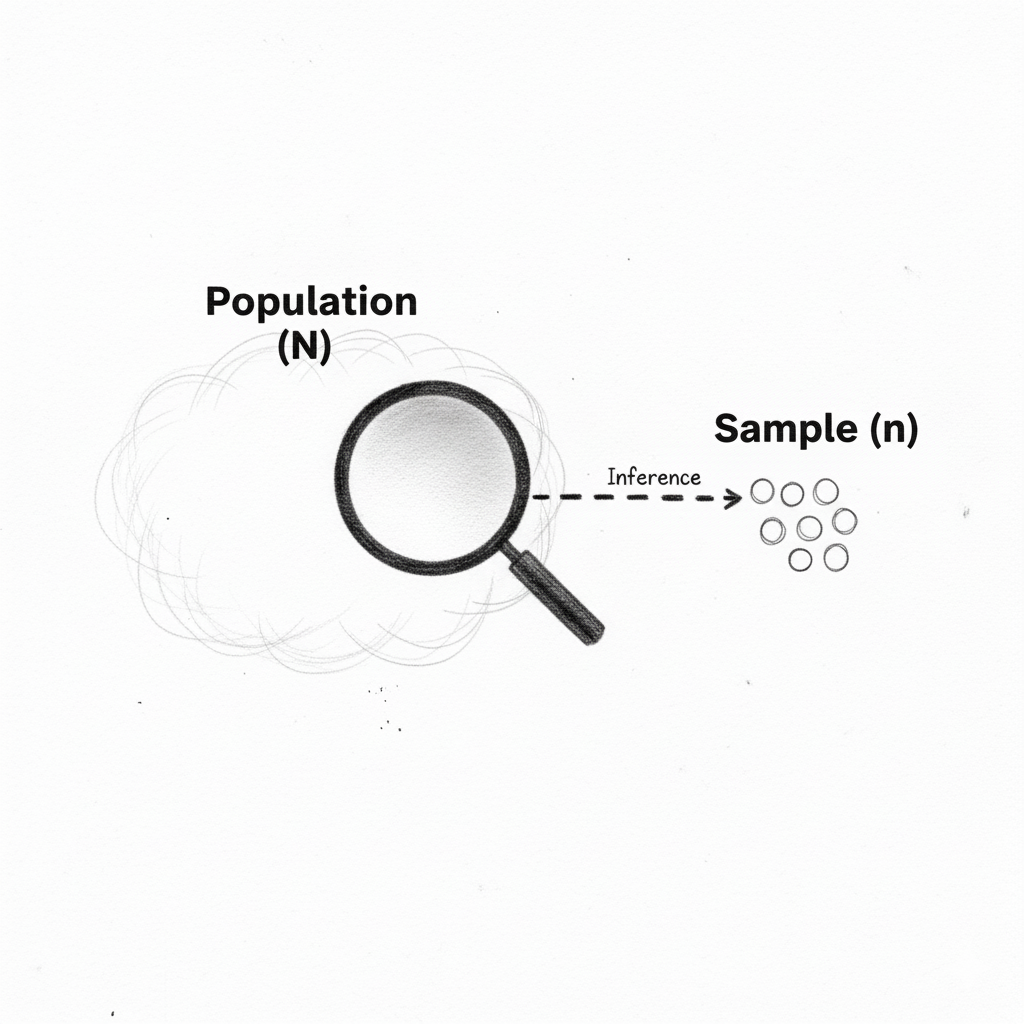
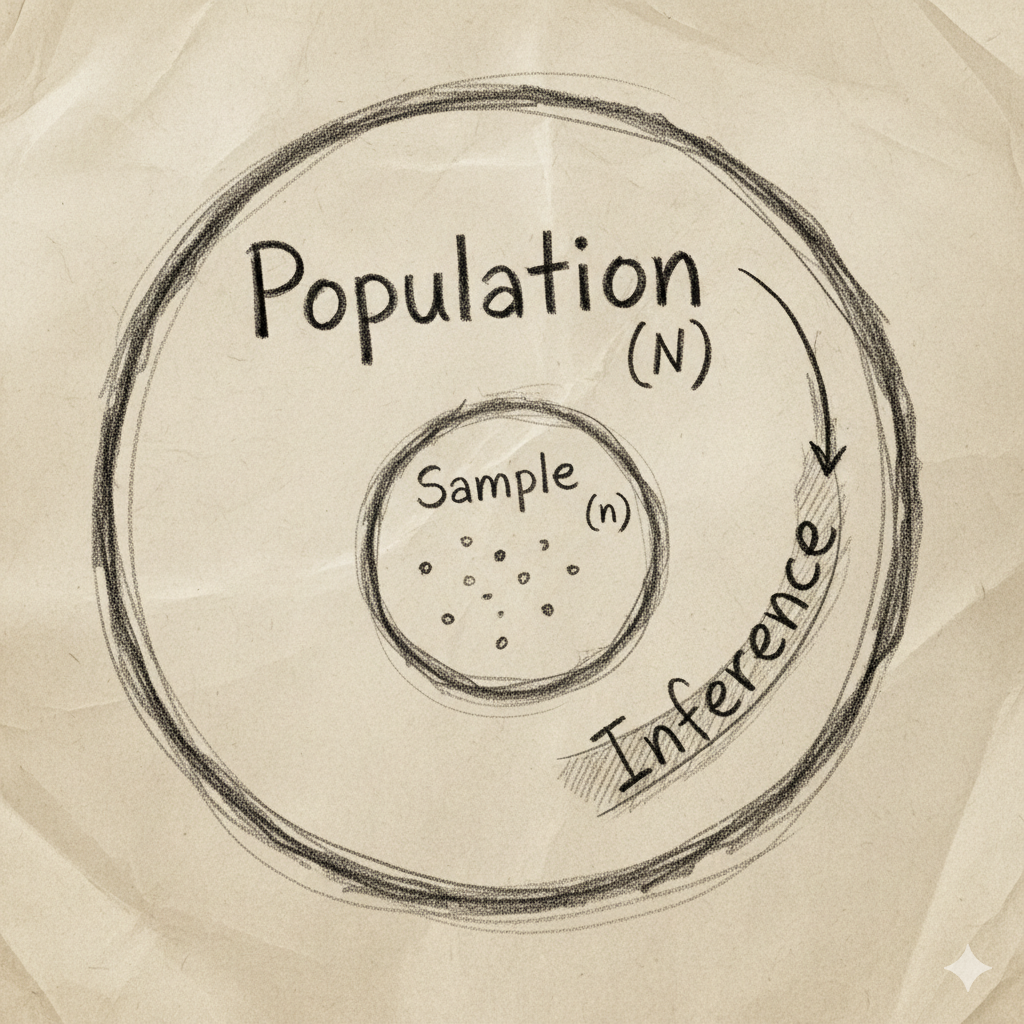
A sample is a small, manageable subset taken from the population. Because it’s often impossible or impractical to study the entire population, we take a sample and use it to conclude the whole.
- Instead of measuring all 150 million men, you might measure 1,000 randomly selected men. This is your sample.
- Instead of testing every lightbulb until it burns out, you might test 500 bulbs. This is your sample.
- Instead of appraising every house, you might look at the sales data for 200 recently sold houses. This is your sample.
The numerical value that describes a characteristic of a sample is called a statistic. The average height of your 1,000-man sample is a sample statistic.
In inferential statistics, our main goal is to use a sample statistic (which we can calculate) to make an educated guess about a population parameter (which we usually don’t know).
Why Do We Need Samples? The Problem of Impracticality
Why don’t we just measure the whole population? It would be more accurate, right?
Yes, but it’s almost always impossible or impractical.
Let’s go back to the “average height of all men in America” example. To find the true population mean, you would need to:
- Find every single man in the country at the exact same time.
- Measure all 150 million of them.
- Add up all their heights and divide by 150 million.
This is not just difficult; it’s physically impossible. By the time you finished measuring, new men would have been born, and others would have passed away. The population itself changes.
Even for a static population (like lightbulbs), it’s often impractical. To find the average lifespan, you would have to test every bulb until it breaks, leaving you with no products to sell.
This is why we sample. Samples are:
- Cost-effective
- Time-efficient
- Practical
We accept a small amount of uncertainty in exchange for the ability to get a good-enough answer.
Demystifying the Notation: Population Mean (\mu) vs. Sample Mean (\bar{x})
Because the distinction is so important, statisticians use different symbols to be clear about what they’re referring to.
When we talk about the mean, this is the most common confusion for beginners.
| Concept | Population Mean | Sample Mean |
| What is it? | The true average of the entire population. | The average of your sample data. |
| Symbol | \mu (the Greek letter “mu”) | \bar{x} (read as “x‑bar”) |
| Type of Value | A Parameter: A fixed, unknown value. | A Statistic: A calculated, known value. |
| Purpose | This is the value we want to know or estimate. | This is the value we use to estimate \mu. |
The calculation is the same (sum of values / number of values), but the symbols tell you what data you’re using.
Decoding the Formulas: Understanding Sigma Notation
In statistics books, you’ll see these formulas written in a way that can look intimidating. Let’s break them down.
The fancy symbol \sum (the capital Greek letter “Sigma”) is just a mathematical instruction that means “add everything up.”
Population Mean (\mu) Formula
\mu = \frac{\sum_{i=1}^{N} X_i}{N}Let’s translate this:
- \mu: This is the population mean we want to find.
- \sum: “Add up…”
- X_i: “…each value (X) in the population, starting from the first one (i=1) up to the last one (N).”
- N: “…and then divide by N, the total number of items in the population.”
In plain English: “Add up every single value in the entire population and divide by the population size.”
Sample Mean (\bar{x}) Formula
\bar{x} = \frac{\sum_{i=1}^{n} x_i}{n}Let’s translate this:
- \bar{x}: This is the sample mean we are calculating.
- \sum: “Add up…”
- x_i: “…each value (x) in our sample, starting from the first one (i=1) up to the last one (n).”
- n: “…and then divide by n, the total number of items in the sample.”
In plain English: “Add up all the values in your sample and divide by the sample size.”
Key Convention: N vs. n
You’ll notice that capital N is used for the Population size (e.g., 150 million men), while lowercase n is used for the Sample size (e.g., the 1,000 men we measured). This is a standard convention in statistics.
The Importance of a Good Sample
The entire hope of this process is that our sample mean (\bar{x}) is a good estimate of the population mean (\mu).
But what if our sample is “skewed”?
If we want to find the average height of American men, but we collect our sample from a college basketball team, our \bar{x} is going to be very high. It will be a terrible estimate of the true \mu. This is called sampling bias.
To get a good estimate, our sample must be random and representative of the population. This means every member of the population has an equal chance of being included in the sample. (We’ll cover sampling techniques in a future post!)
Key Takeaways
- A Population (N) is the entire group you want to study.
- A Sample (n) is a small subset of that group.
- We use samples because studying the entire population is usually impossible or impractical.
- The Population Mean (\mu) is a fixed, unknown parameter we want to find.
- The Sample Mean (\bar{x}) is a calculated statistic we use to estimate \mu.
- The formulas are the same (sum divided by count), but the notation (\mu vs. \bar{x} and N vs. n) is different to show this critical distinction.
Frequently Asked Questions (FAQ)
1. Why don’t we just call both of them the “mean”?
We do! But we must specify which mean. \mu is the population mean, and \bar{x} is the sample mean. Being precise is critical in statistics to avoid confusion.
2. Is the sample mean (\bar{x}) always close to the population mean (\mu)?
Not always, especially with small or biased samples. The goal of good statistical practice is to collect a sample that is large enough and random enough to ensure \bar{x} is a reliable estimate of \mu.
3. What does x_i mean in the formula?
The ‘i’ is an “index” variable. It’s just a placeholder. x_i means “the i-th value in the dataset.” So x_1 is the first value, x_2 is the second, and so on, up to x_n (the last value in the sample).
Leave a Reply